Full stack, all-in-one solution
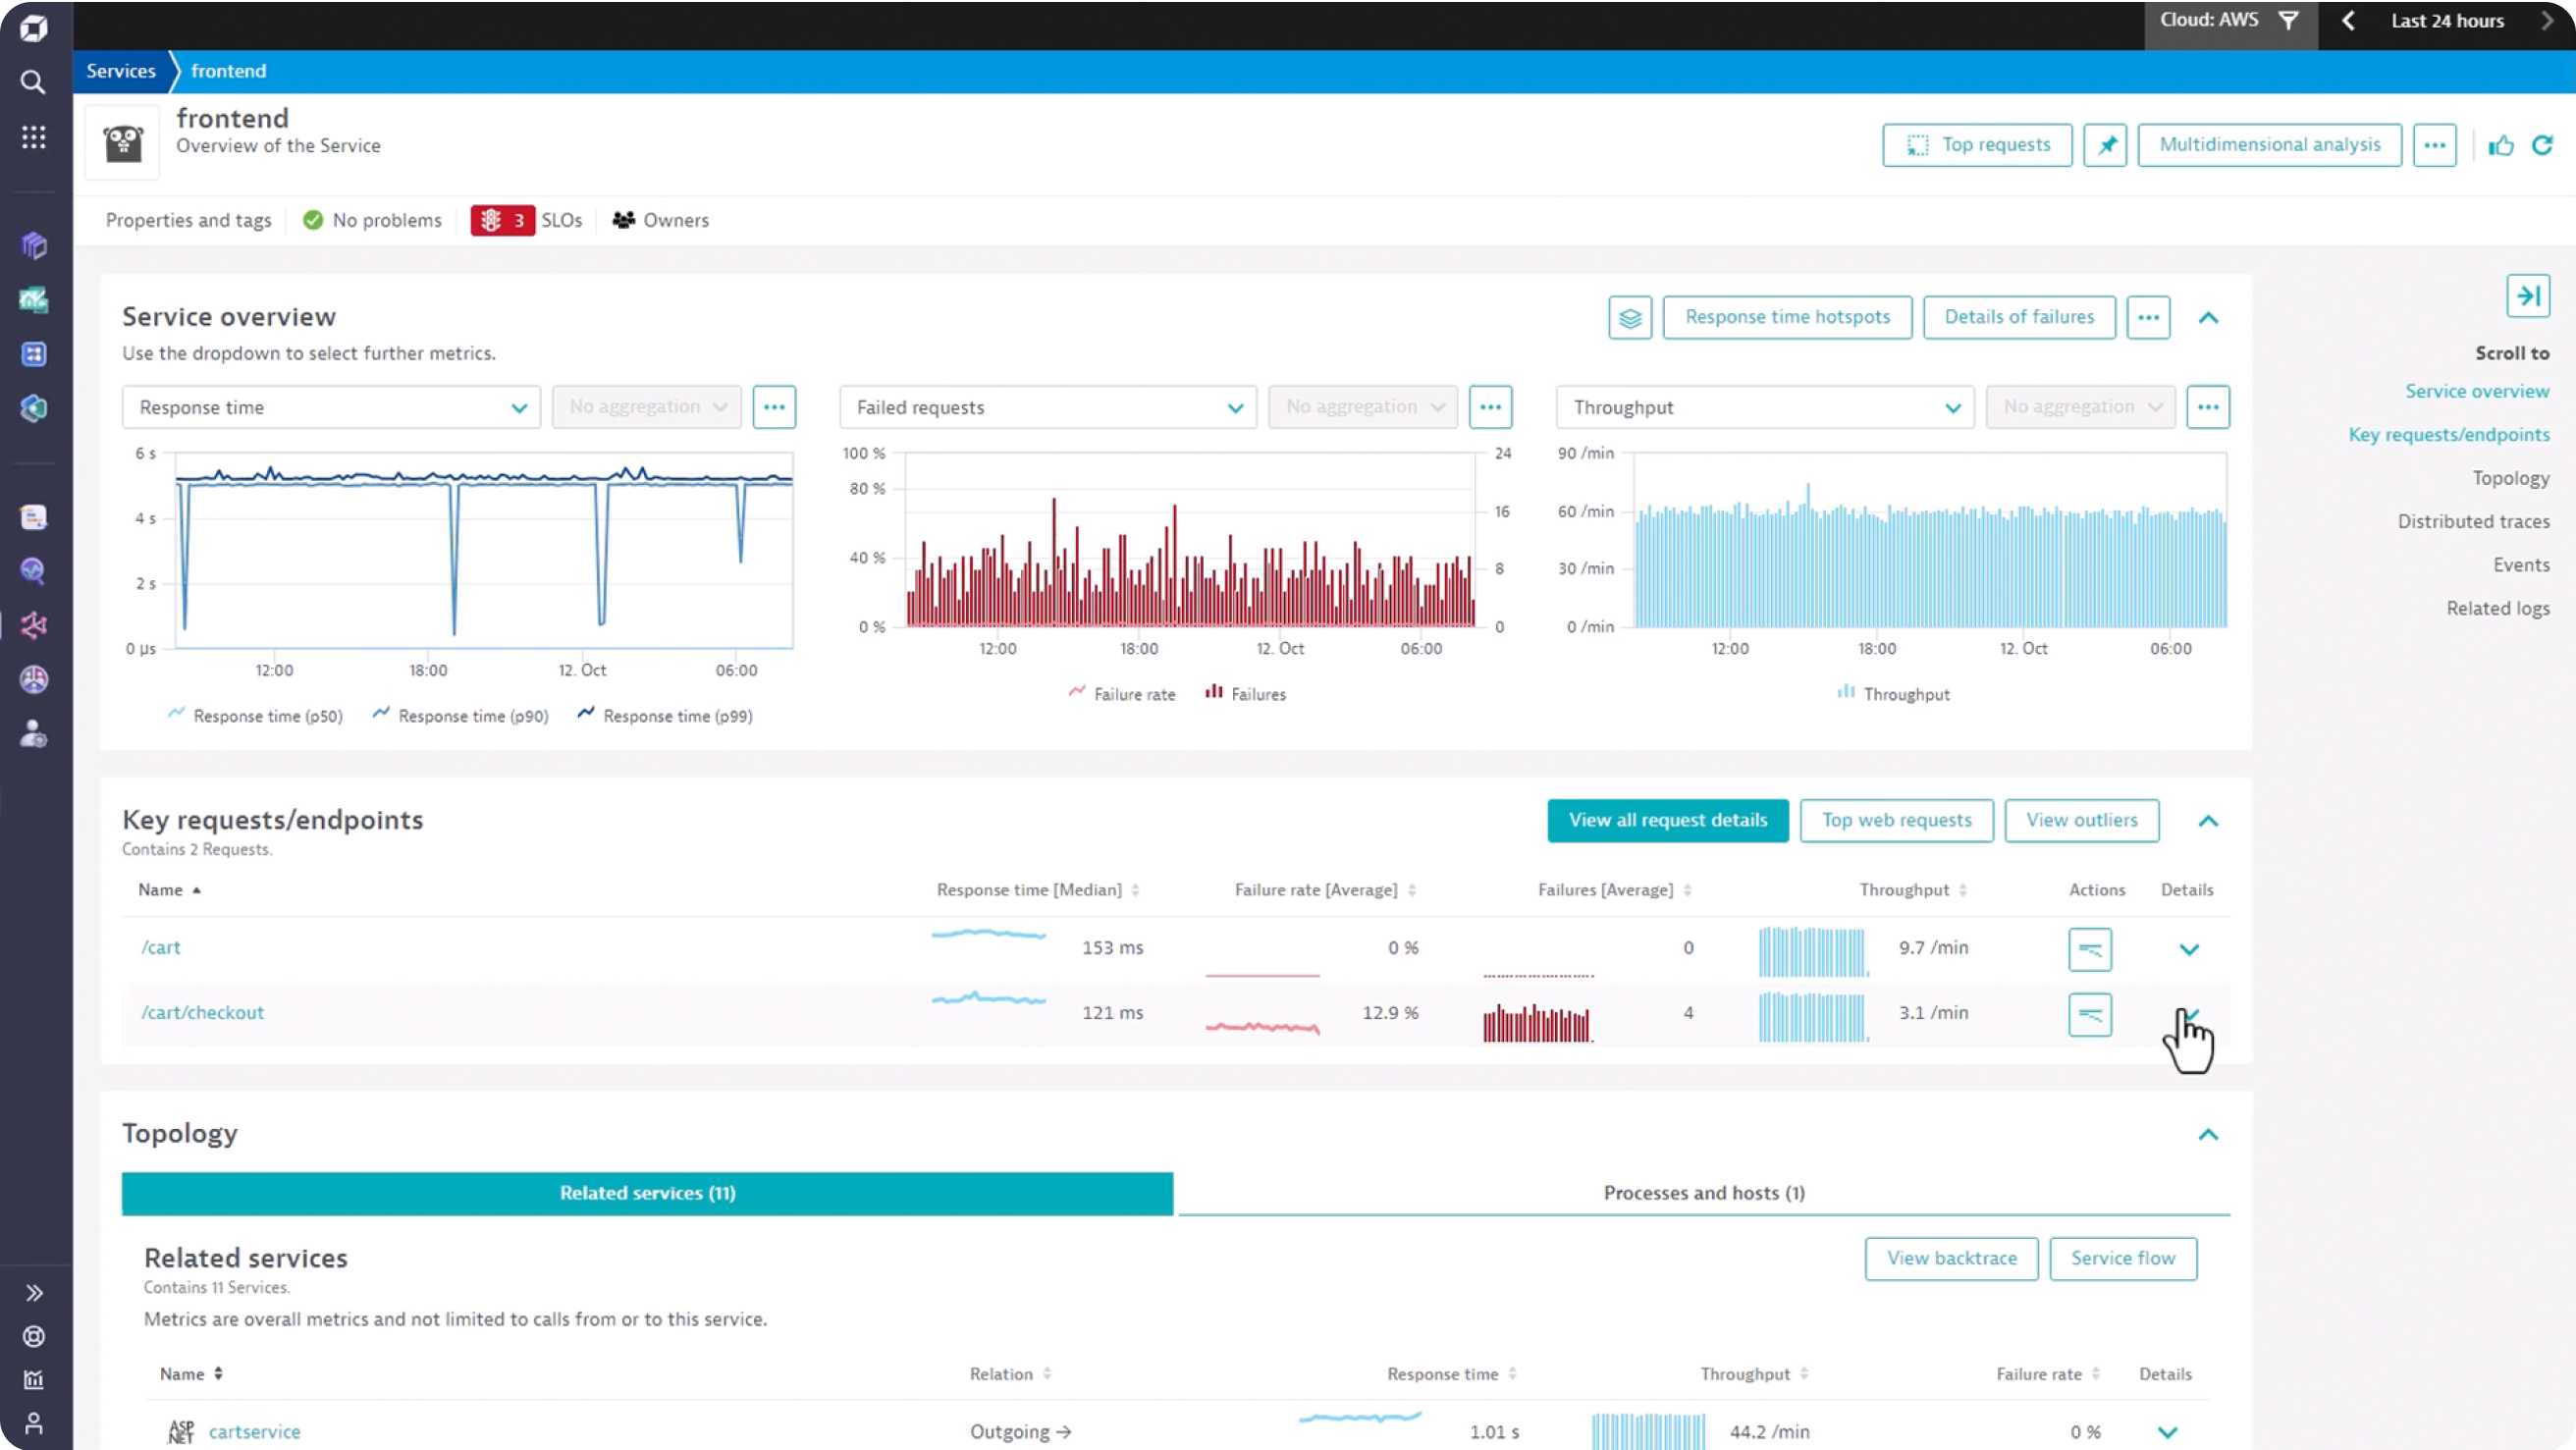
Application performance monitoring, infrastructure monitoring and AIOps are all in one solution, with the option to add digital experience and business analytics functionality. Understand all relationships and dependencies in the entire stack for precise answers.
Automatic monitoring of local workloads and micro services in the cloud
Dynatrace automatically discovers and monitors dynamic micro-service workloads operating in containers at Kubernetes. See how they perform, how they communicate with each other, and immediately detect low performing micro services.
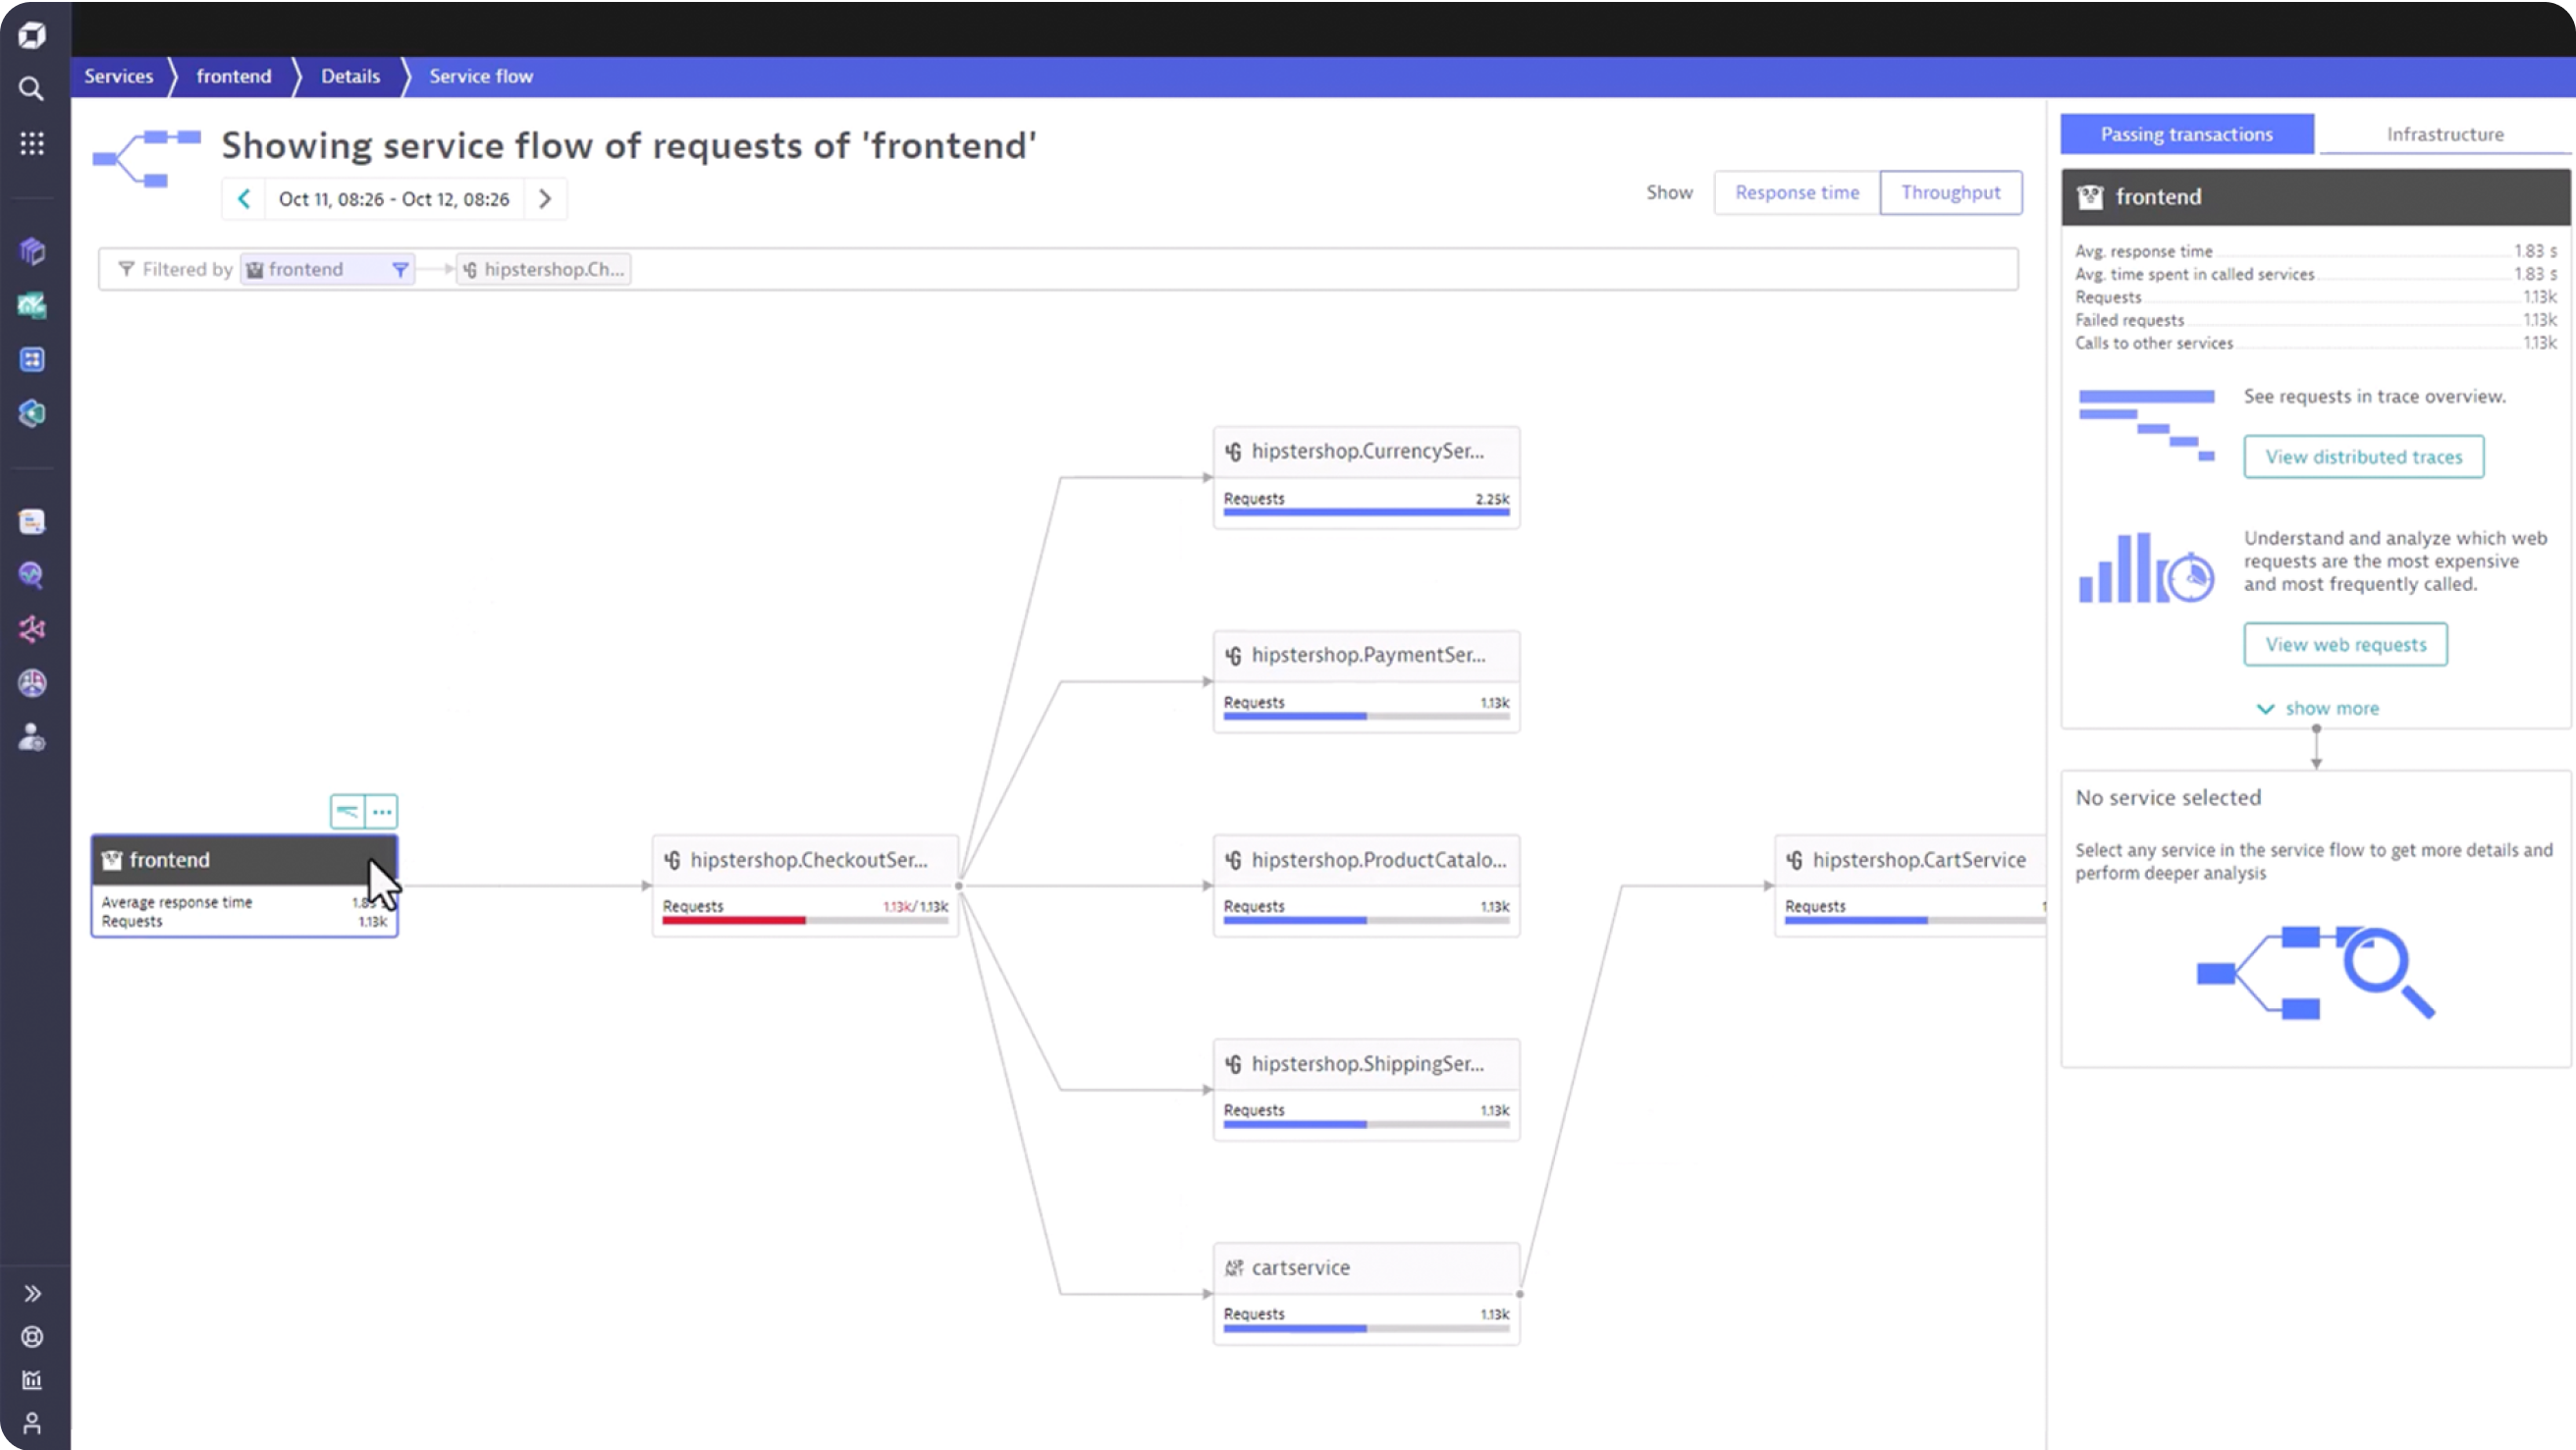
Full visibility in micro service communication
Modern applications rely on messaging systems to communicate between services. Dynatrace automatically discovers and monitors all message queues that allow you to detect low performing services and take proactive action before users are affected.
Improve production quality with code-level monitoring
Automatically capture transactions on each layer up to the code level. Goes deep to analyse and optimize performance for the enhanced user experience.
Install new code on production faster and at higher quality
Gain situational awareness of your DevOps trading lines - every structure and distribution, all user behaviour and supporting infrastructure. Automate quality doors and quickly fix problems.
Automatic SQL/NoSQL Database Monitoring
Automatically detect and monitor databases, understand how applications use them, and take detailed health measurements for each database statement. Identify and resolve database problems that affect application performance.
